
200 Years of the Gold-to-Silver Ratio
200 Years of the Gold-to-Silver Ratio
Gold and silver have been precious and monetary metals for millennia, with the gold-to-silver ratio having been measured since the days of Ancient Rome.
Historically, the ratio between gold and silver played an important role in ensuring coins had their appropriate value, and it remains an important technical metric for metals investors today.
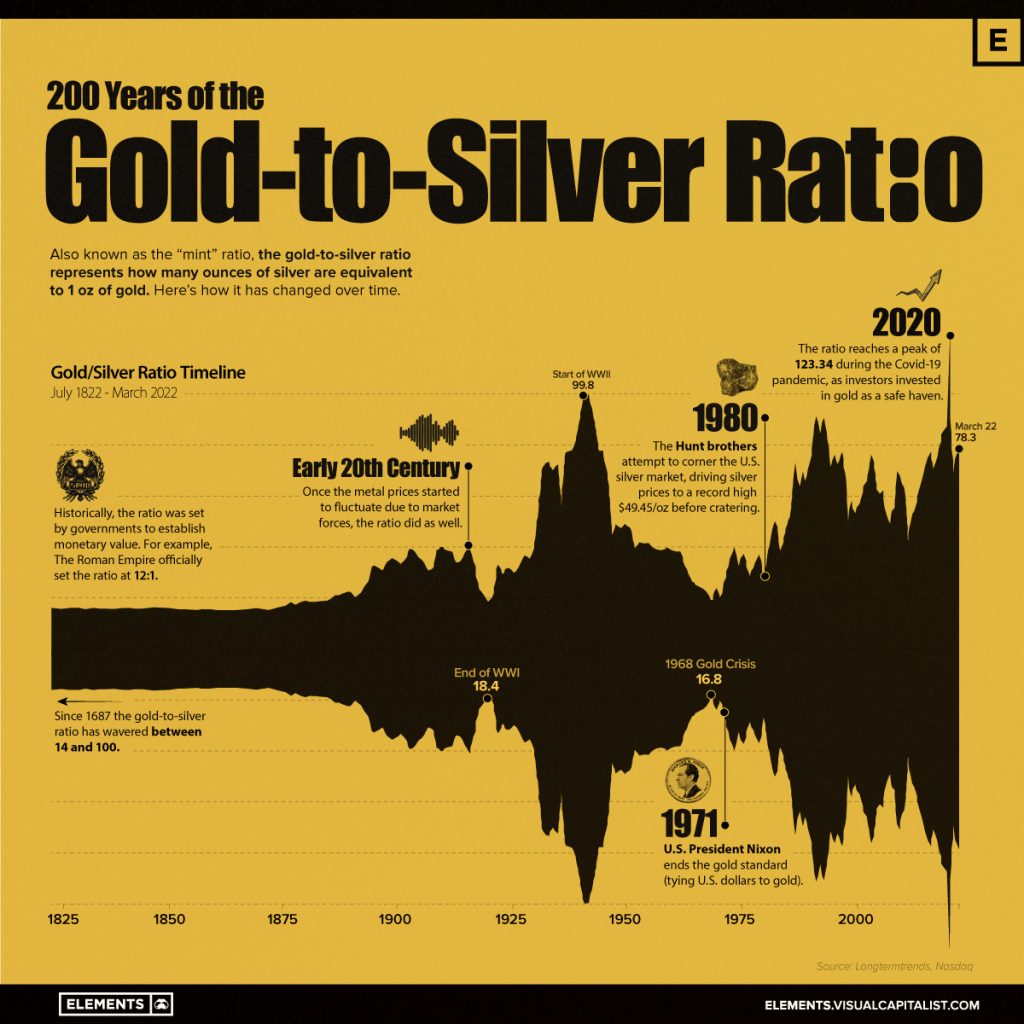
This graphic charts 200 years of the gold-to-silver ratio, plotting the pivotal historical events that have shaped its peaks and valleys.
What is the Gold-to-Silver Ratio?
The gold-to-silver ratio represents the amount of silver ounces equivalent to a single ounce of gold, enabling us to see if one of the two precious metals is particularly under or overvalued.
Gold has always been more expensive than silver, however if the ratio were to fall below 1 this would no longer be the case. This is not a fixed ratio, and changes regularly depending on the current spot price of the metals.
While their price movements are often influenced by many of the same factors, namely inflation and general sentiment towards other investments, their prices don’t always move at the same rate. As such the relationship between the two precious metals has varied a lot throughout time.
Currently, the ratio sits at about 80 ounces of silver equivalent to one ounce of gold. This is after the ratio spiked to new highs of 123.3 during the COVID-19 pandemic.
While gold is primarily viewed as an inflation and recession hedge, silver is also an industrial metal and asset. The ratio between the two can reveal whether industrial metals demand is on the rise or if an economic slowdown or recession may be looming.
The History of the Gold-to-Silver Ratio
Long before the gold-to-silver ratio was allowed to float freely, the ratio between these two metals was fixed by empires and governments to control the value of their currency and coinage.
The earliest recorded instance of the gold-to-silver ratio dates back to 3200 BCE, when Menes, the first king of Ancient Egypt set a ratio of 2.5:1. Since then, the ratio has only seen gold’s value rise as empires and governments became more familiar with the scarcity and difficulty of production for the two metals.
Gold and Silver’s Ancient Beginnings
Ancient Rome was one of the earliest ancient civilizations to set a gold-to-silver ratio, starting as low as 8:1 in 210 BCE. Over the decades, varying gold and silver inflows from Rome’s conquests caused the ratio to fluctuate between 8-12 ounces of silver for every ounce of gold.
By 46 BCE, Julius Caesar had established a standard gold-to-silver ratio of 11.5:1, shortly before it was bumped to 11.75:1 under emperor Augustus.
As centuries progressed, ratios around the world fluctuated between 6-12 ounces of silver for every ounce of gold, with many Middle Eastern and Asian empires and nations often valuing silver more highly than Western counterparts, thus having a lower ratio.
The Rise of the Fixed Ratio
By the 18th century, the gold-to-silver ratio was being redefined by the U.S. government’s Coinage Act of 1792 which set the ratio at 15:1. This act was the basis for U.S. coinage, defining coins’ values by their metallic compositions and weights.
Around the same time period, France had enacted a ratio of 15.5:1, however, neither of these fixed ratios lasted long. The growth of the industrial revolution and the volatility of two world wars resulted in massive fluctuations in currencies, gold, and silver. By the 20th century, the ratio had already reached highs of around 40:1, with the start of World War II further pushing the ratio to a high of nearly 100:1.
Recently in 2020, the ratio set new highs of more than 123:1, as pandemic fears saw investors pile into gold as a safe-haven asset. While the gold-to-silver ratio has since fallen to roughly 80:1, runaway inflation and a potential recession has put gold in the spotlight again, likely bringing further volatility to this historic ratio.
The gold-silver ratio, also known as the mint ratio, refers to the relative value of an ounce of silver to an equal weight of gold. Put simply, it is the quantity of silver in ounces needed to buy a single ounce of gold. Traders can use it to diversify the amount of precious metal they hold in their portfolio.
This is how it works. When gold trades at $500 per ounce and silver at $5, traders refer to a gold-silver ratio of 100:1. Similarly, if the price of gold is $1,000 per ounce and silver is trading at $20, the ratio is 50:1. Today, the ratio floats and can swing wildly. The reason being is gold and silver are valued daily by market forces, but this has not always been the case. The ratio has been permanently set at different times in history and in different places, by governments seeking monetary stability.
Gold-Silver Ratio History
The gold-silver ratio has fluctuated in modern times and never remains the same. That’s mainly due to the fact that the prices of these precious metals experience wild swings on a regular, daily basis. But before the 20th century, governments set the ratio as part of their monetary stability policies.
For hundreds of years prior to that time, the ratio, often set by governments for purposes of monetary stability, was fairly steady, ranging between 12:1 and 15:1. The Roman Empire officially set the ratio at 12:1. The U.S. government fixed the ratio at 15:1 with the Coinage Act of 1792
5 Year Ratio:
Although this is not guaranteed, the ratio will usually rise during precious metals bear markets, meaning the gap between their values widens, and fall during bull markets, meaning gold becomes less valuable in relation to silver. This is because silver is typically a much more volatile metal than gold, so its price will experience radical fluctuations depending on the nature of the market.
The 5 year period between 2011 and 2016 is a perfect example of this. Since 2011, when the silver price peaked, the ratio has more than doubled. In April 2011 an ounce of gold was worth around 31 times more than an ounce of silver, as of February 2016 that ratio has reached almost 80: 1.
While the price of both of these metals has dropped significantly since then, silver fell to almost a third of its 2011 value, falling from around £29 per ounce to just over £10 per troy ounce in 2016. To put the ratio into perspective, it was possible to buy more than 70 x 1kg silver bullion bars for the same amount of money as a 1kg gold bullion bar. The volatile nature of the silver price is the main reason behind the ratio’s tendency to fluctuate to such a great extent.
While this was not the highest the ratio has ever been, the value of silver had rarely been so low compared to gold. This made silver a potentially attractive investment in 2016, as its price was very cheap in relation to gold, but now in 2018 we’re bordering on record margins between gold and silver.
Based on historical trends it is possible that, should precious metals experience another boom, the silver price could soar, tightening the ratio significantly.
Does Gold To Silver Ratio Matter?
Investors who trade gold bullion, silver bullion and other precious metals scrutinize the gold-to-silver ratio as a signal for the right time to buy or sell a particular metal. When the ratio is high, the general consensus is that silver is favored.
Despite not having a fixed ratio, the gold-silver ratio is still a popular tool for precious metals traders. They can, and still do, use it to hedge their bets in both metals—taking a long position in one, while keeping a short position in the other metal. So when the ratio is higher, and investors believe it will drop along with the price of gold compared to silver, they may decide to buy silver and take a short position in the same amount of gold.
What Happens When Gold Silver Ration is High?
Put quite simply, when the ratio rises, the price of gold is higher, so you would need more ounces of silver to buy one ounce of gold. A high ratio can mean that silver is a relative bargain buy. Therefore, it could be an excellent time to buy silver because the price is down.
Can Silver Hit 100$ An Ounce?
If inflation continues to rise and reaches double-digit values through 2022 and 2023, the price of $100 an ounce for silver could be possible. Consider that in 2021, we saw inflation rates averaging around 5%, which was the highest rate since 2008
When Should I Buy Silver Based on Ratio?
If the gold silver ratio is high, it means that it is the right time to buy silver, since the ratio is more favourable to silver. For example, assuming a gold silver ratio of 50 to 1, investors would have to only part with 1 ounce of gold to acquire 50 ounces of silver.
Summary
There’s a huge amount of permutations available to the gold-silver ratio trader. What’s most important is that the investor knows their own trading personality and risk profile. For the hard-asset investor concerned with the ongoing value of their nation’s fiat currency, the gold-silver ratio trade offers the security of knowing, at the very least, that they always possess the metal.
For more information, read our article “should you buy gold in a recession?”